Vision in thought. Value in design.
At PriceLabs (30 → 400 people) I shipped its first mobile app, a design system used across the product, and pricing tools 600,000+ hosts rely on. Next: making your complex product simple.

Product, motion and interaction designer working across UX, UI, prototypes and AI-assisted workflows. I help teams move from rough ideas to clear screens, working prototypes and shipped products at high speed, without losing the craft that makes an experience feel simple.
Selected work
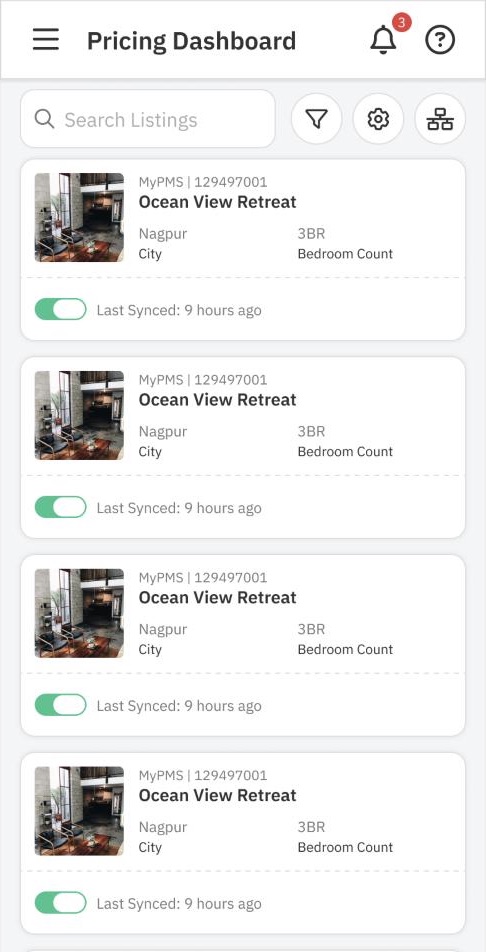
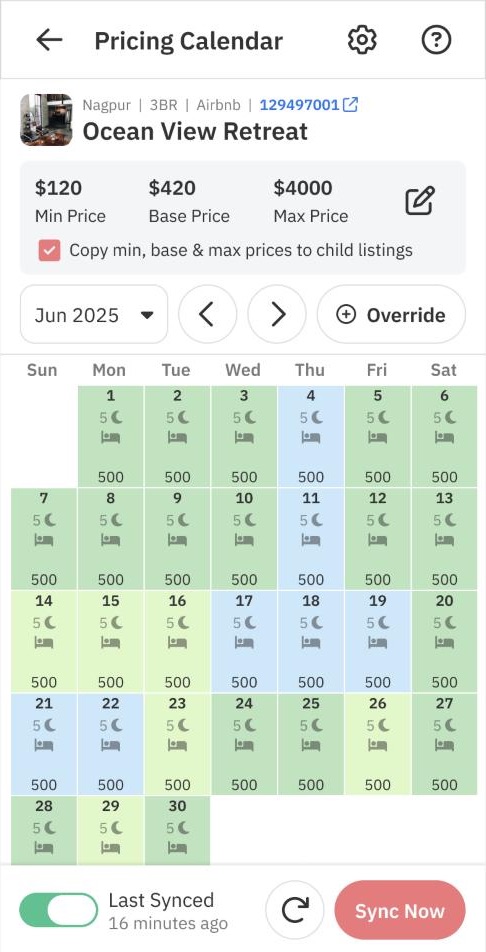
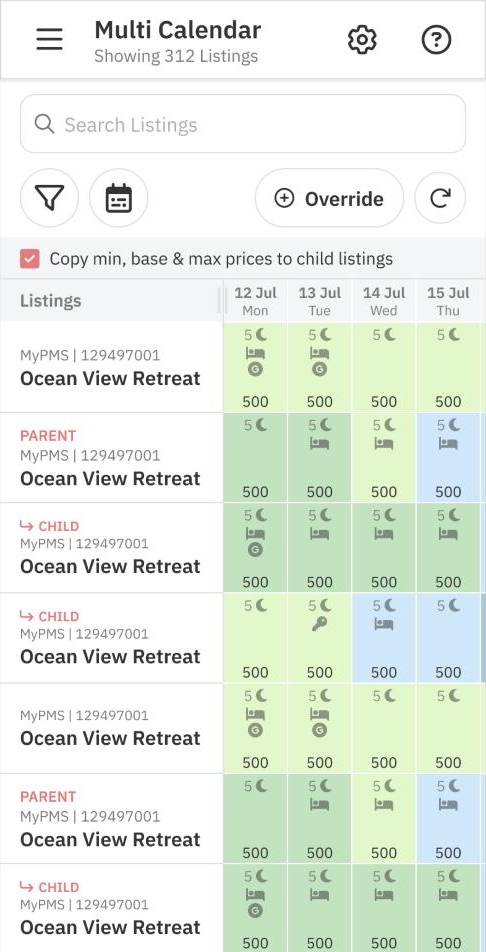
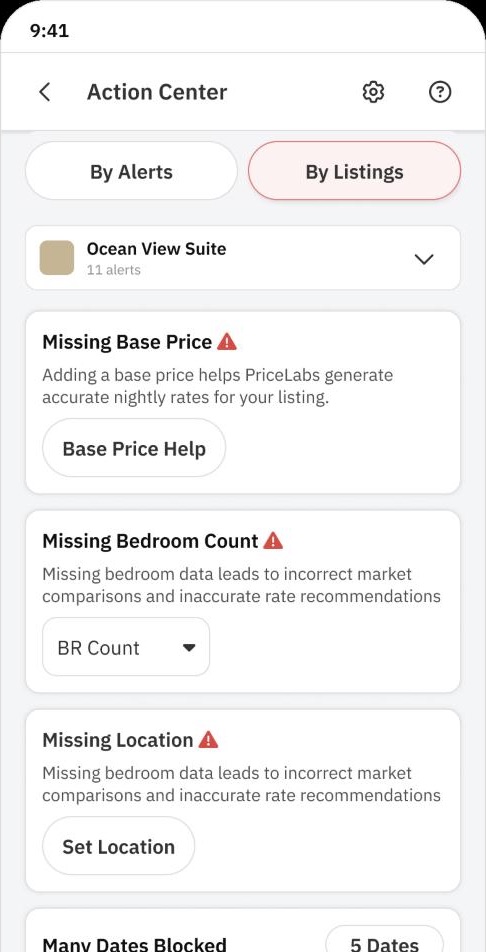
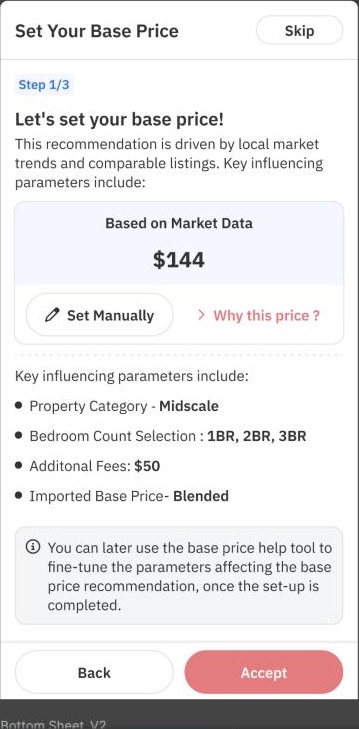
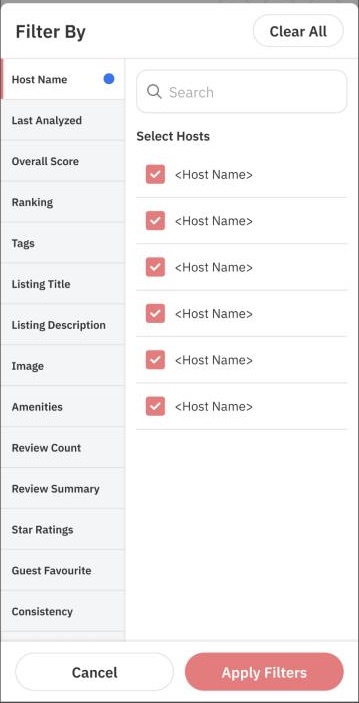
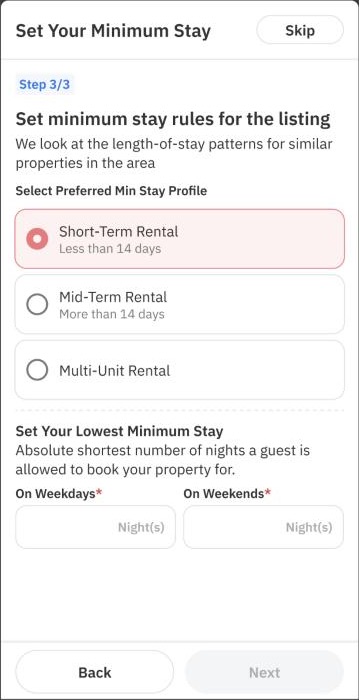
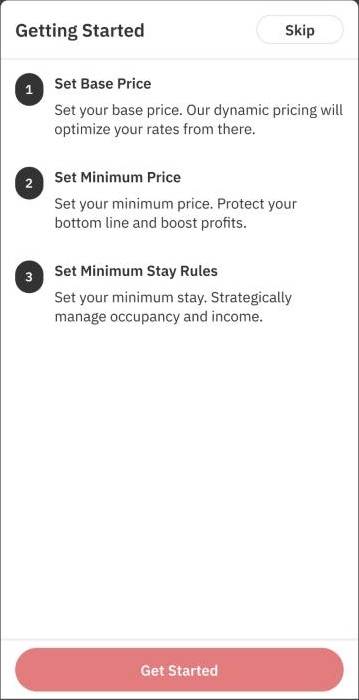
Making a complex revenue tool simple enough for your pocket
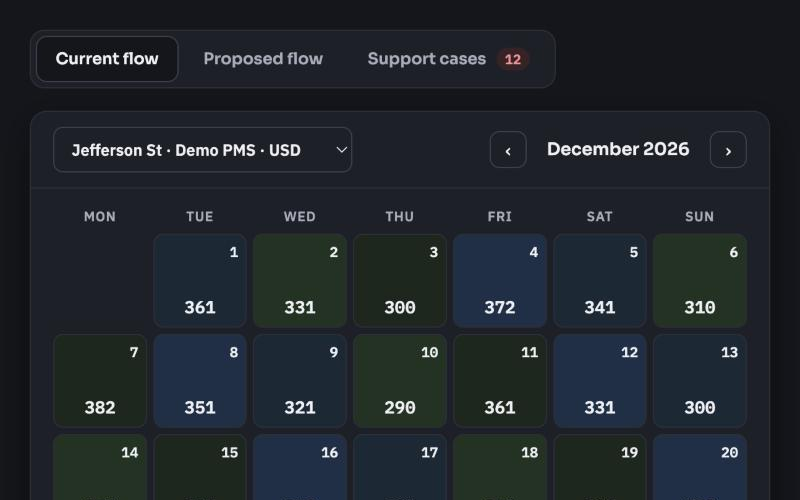
PriceLabs' first iOS and Android app. I scoped on-the-go use cases from usage data, built a mobile layer on the design system and redesigned the calendar around quick overrides.
0 → 11K+ paying users in 90 daysAre my bookings slow for October? Is it me or the market?
Market −6 pts, you −19. 13 pts are yours.
Lever: DSO −8% on Oct 10–20
RM AI agent
An AI agent that tells revenue managers why bookings dropped, specced and prototyped in a two-day hackathon.
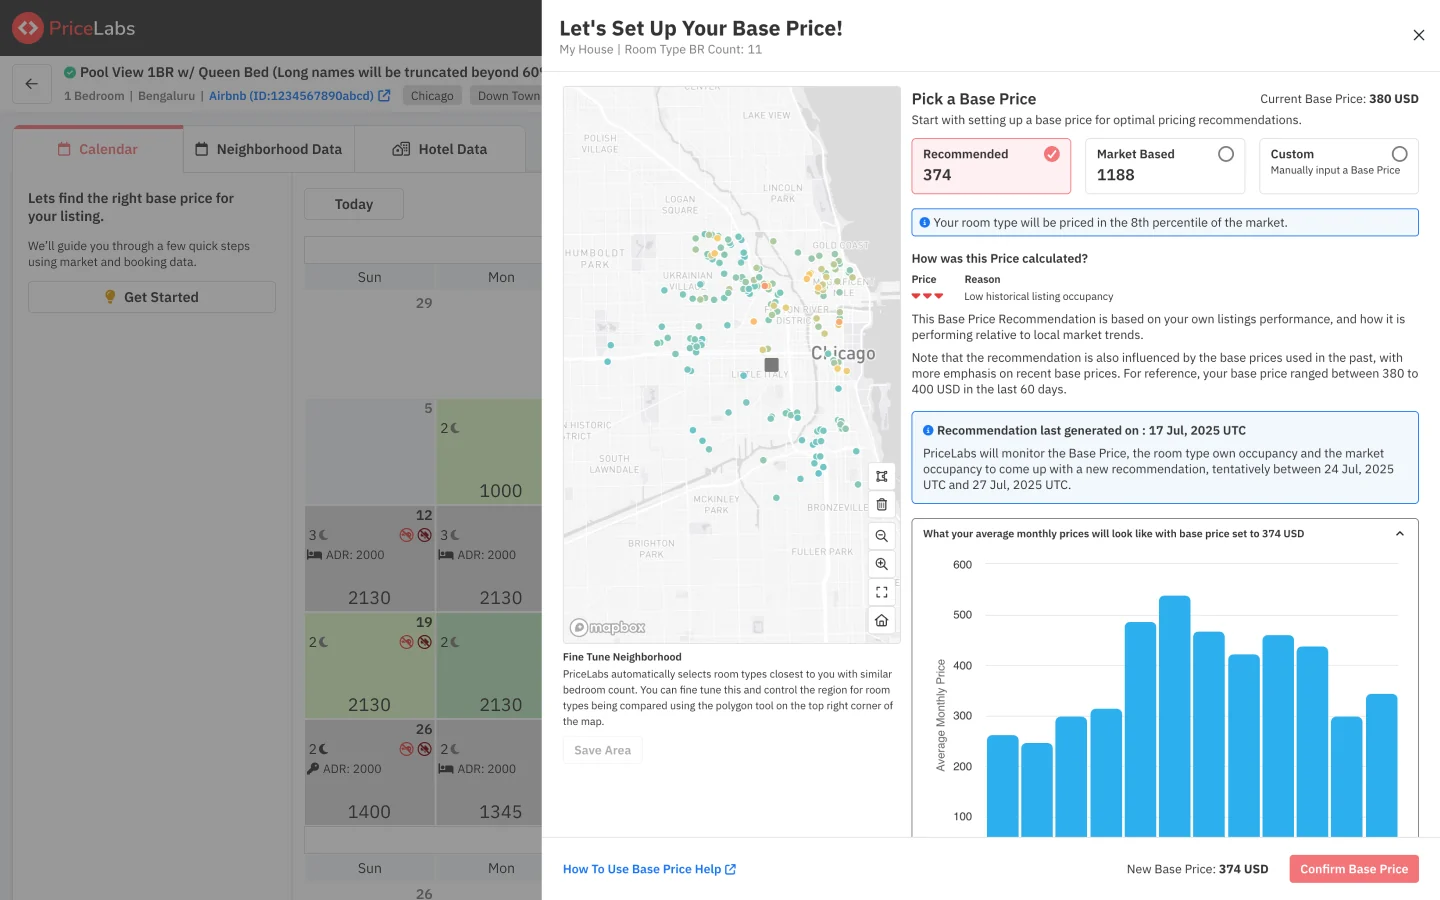
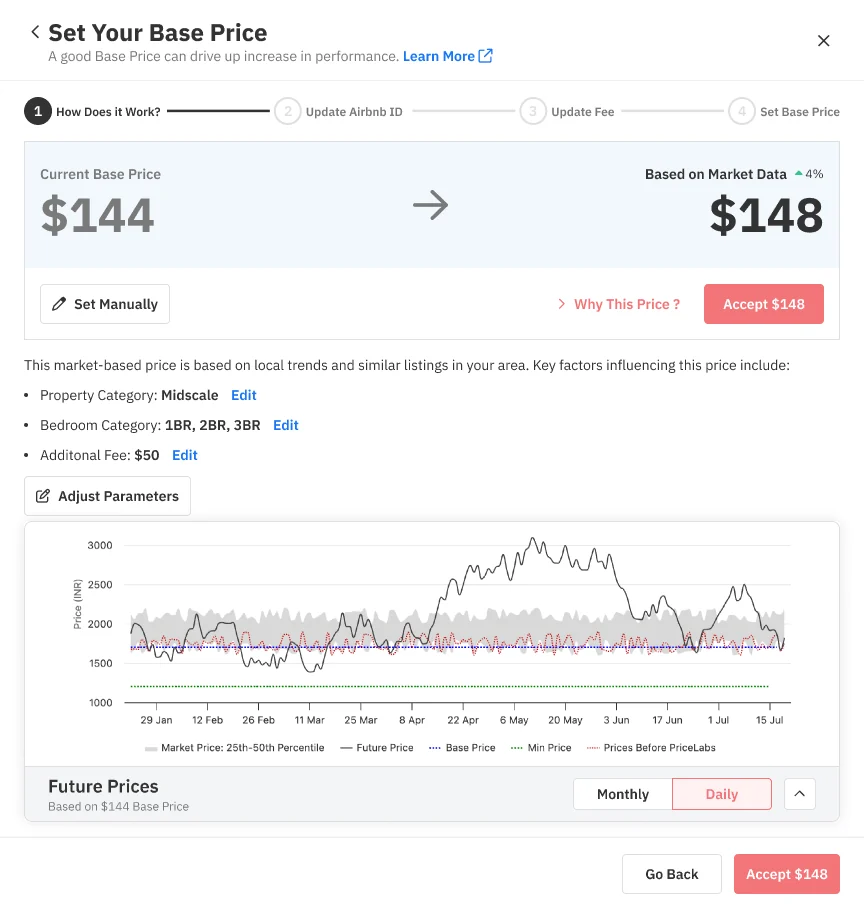
Three competing price suggestions, turned into one
One algorithm-backed recommendation with visible reasoning, in place of three numbers that could differ by 3×. A better explanation measurably raised trust.
55.5% → 59.8% acceptance in an A/B test of 21.7K users
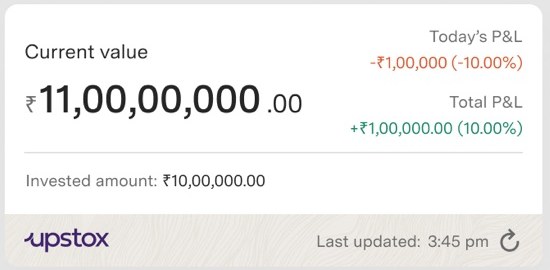
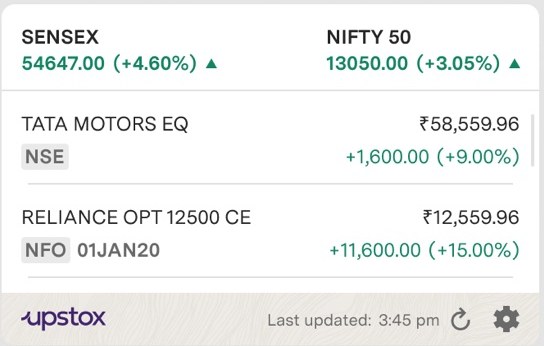
Your portfolio at a glance
The first Android home-screen widgets for Upstox, with a no-graph fallback and eight designed states.
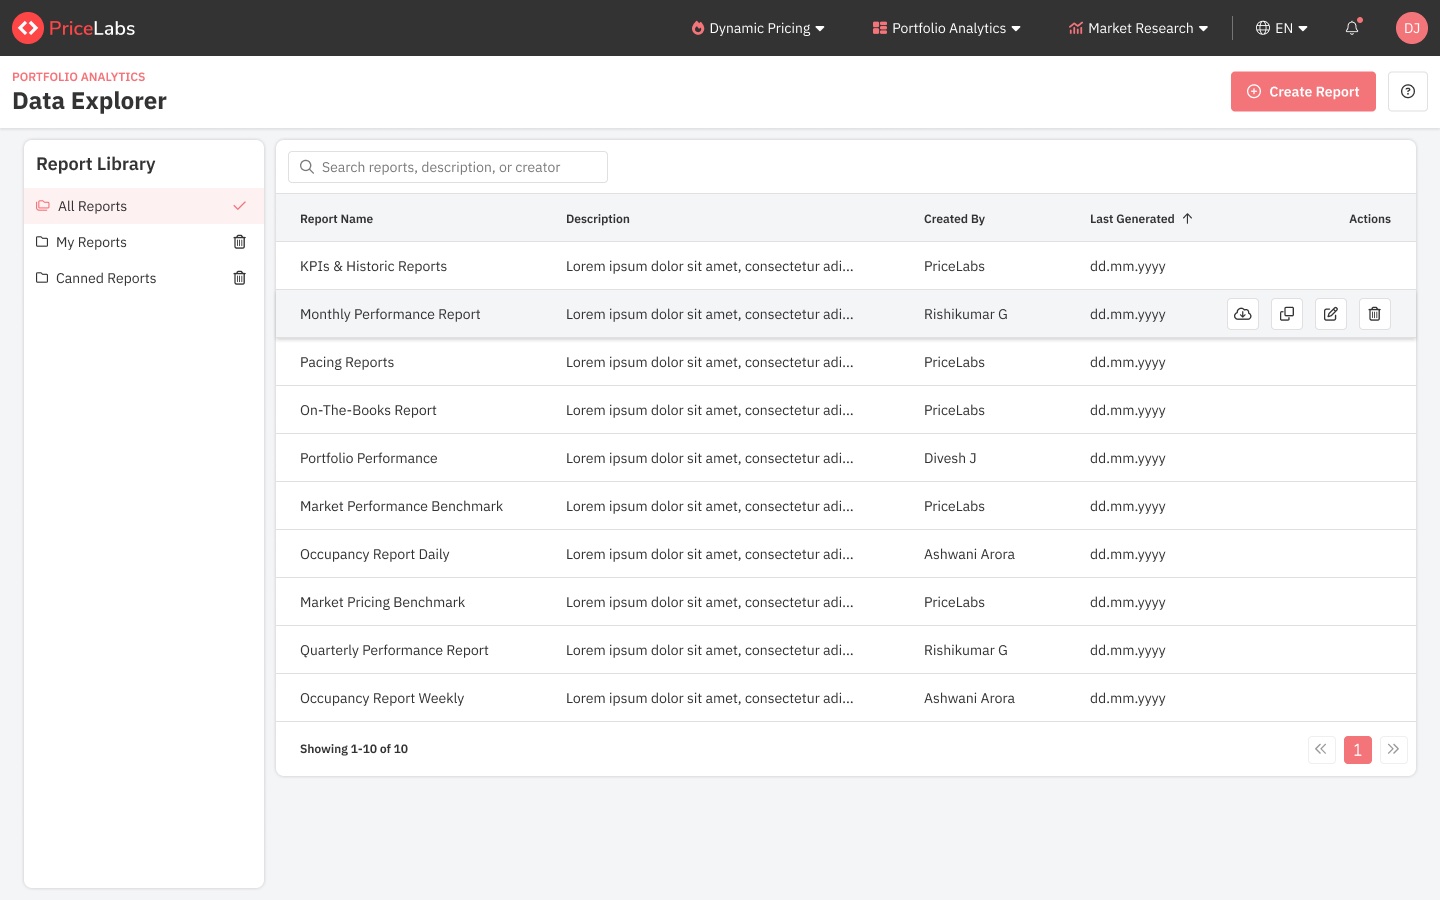
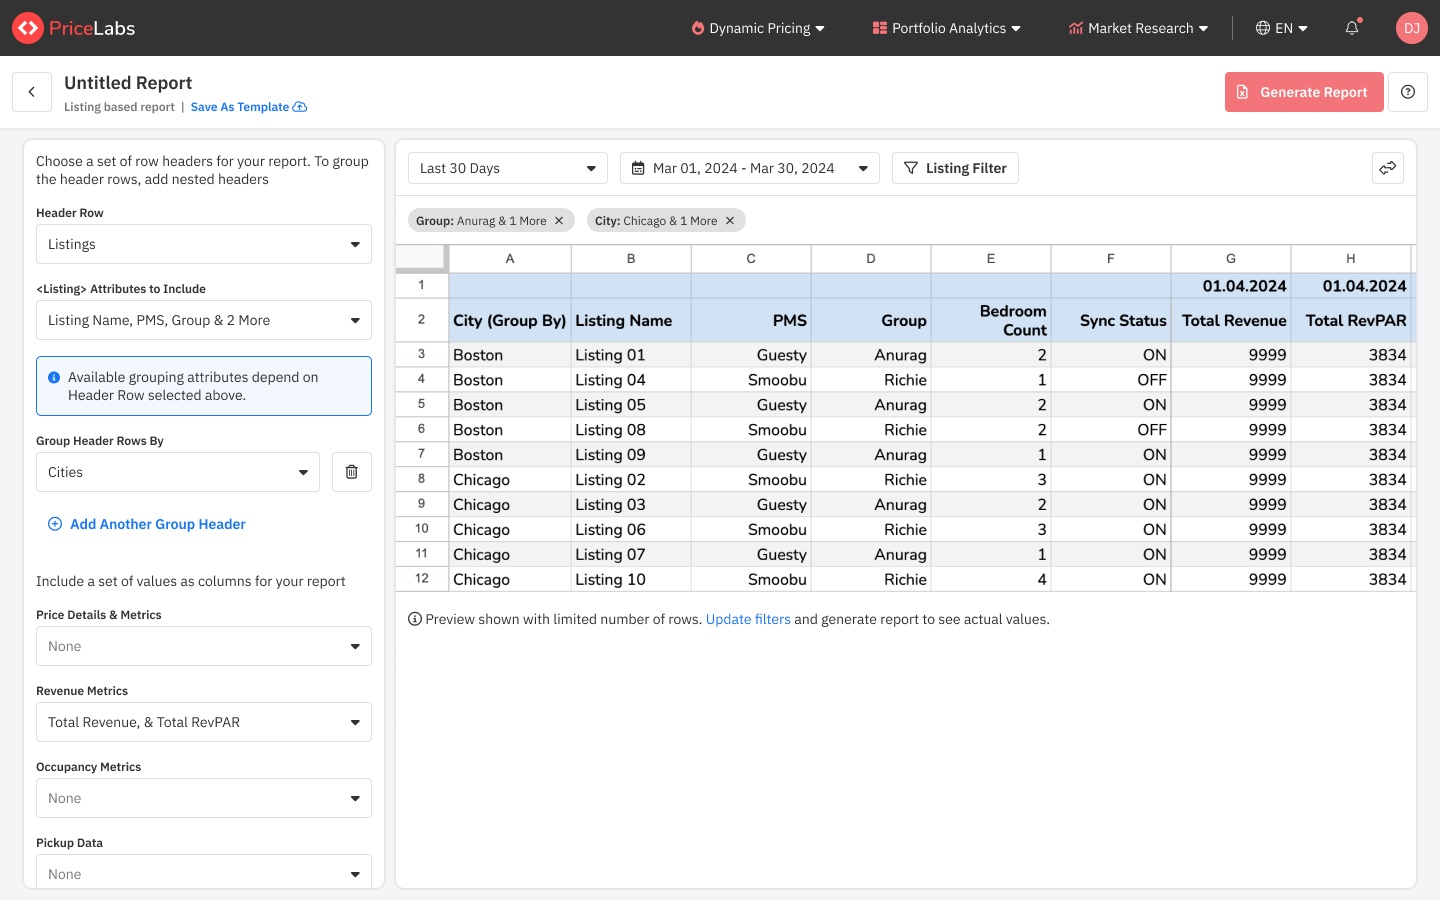
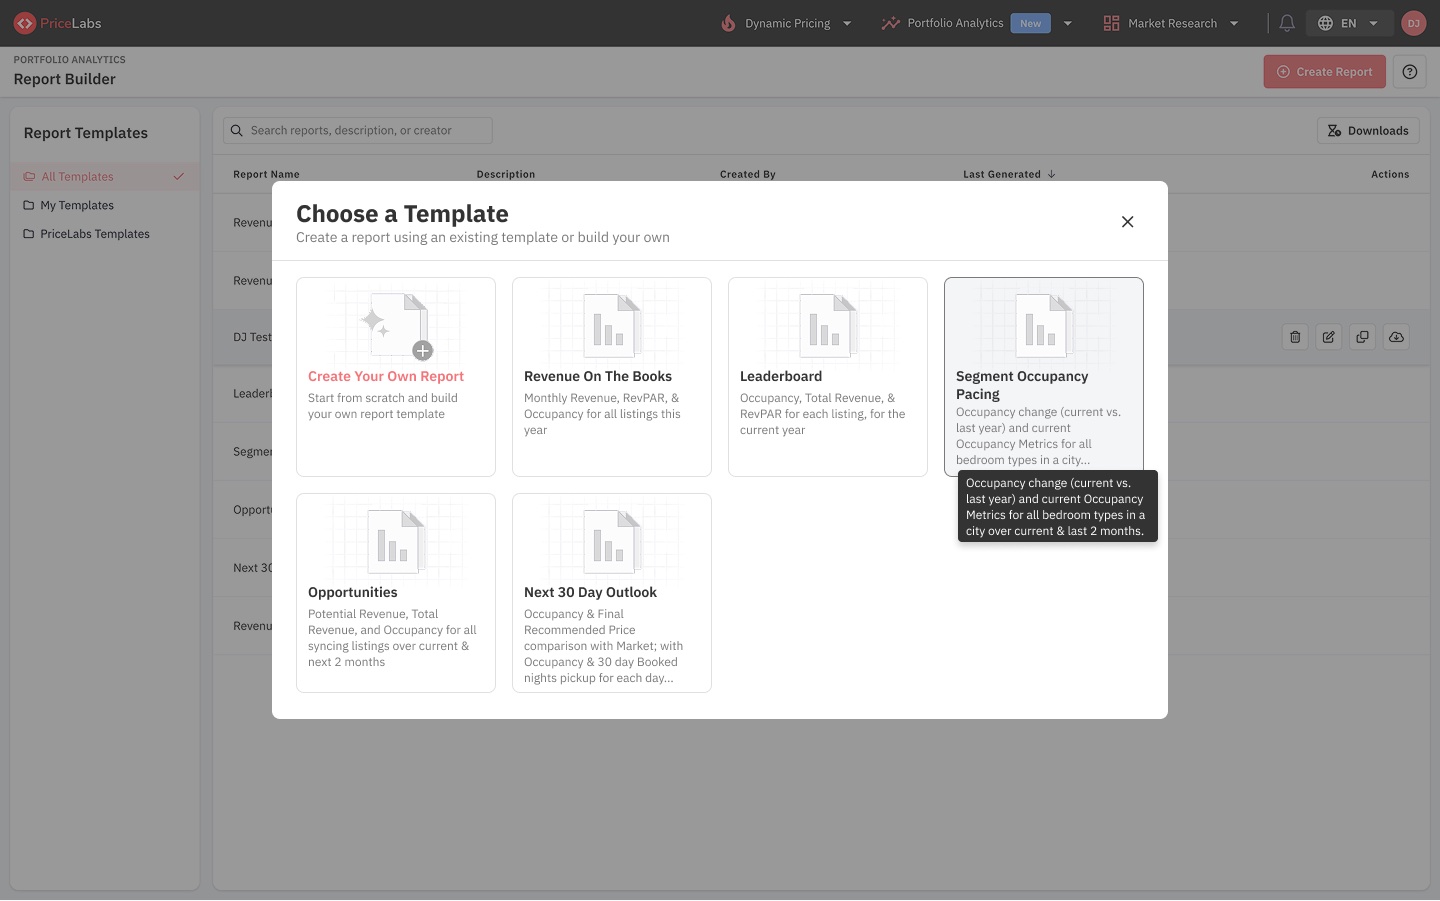
Report Builder: any report, built by the people who need it
Large portfolios each track revenue their own way. The Report Builder lets them pick rows, columns, metrics and formats, preview the result as a spreadsheet, and save it as a template, instead of waiting for a custom export.
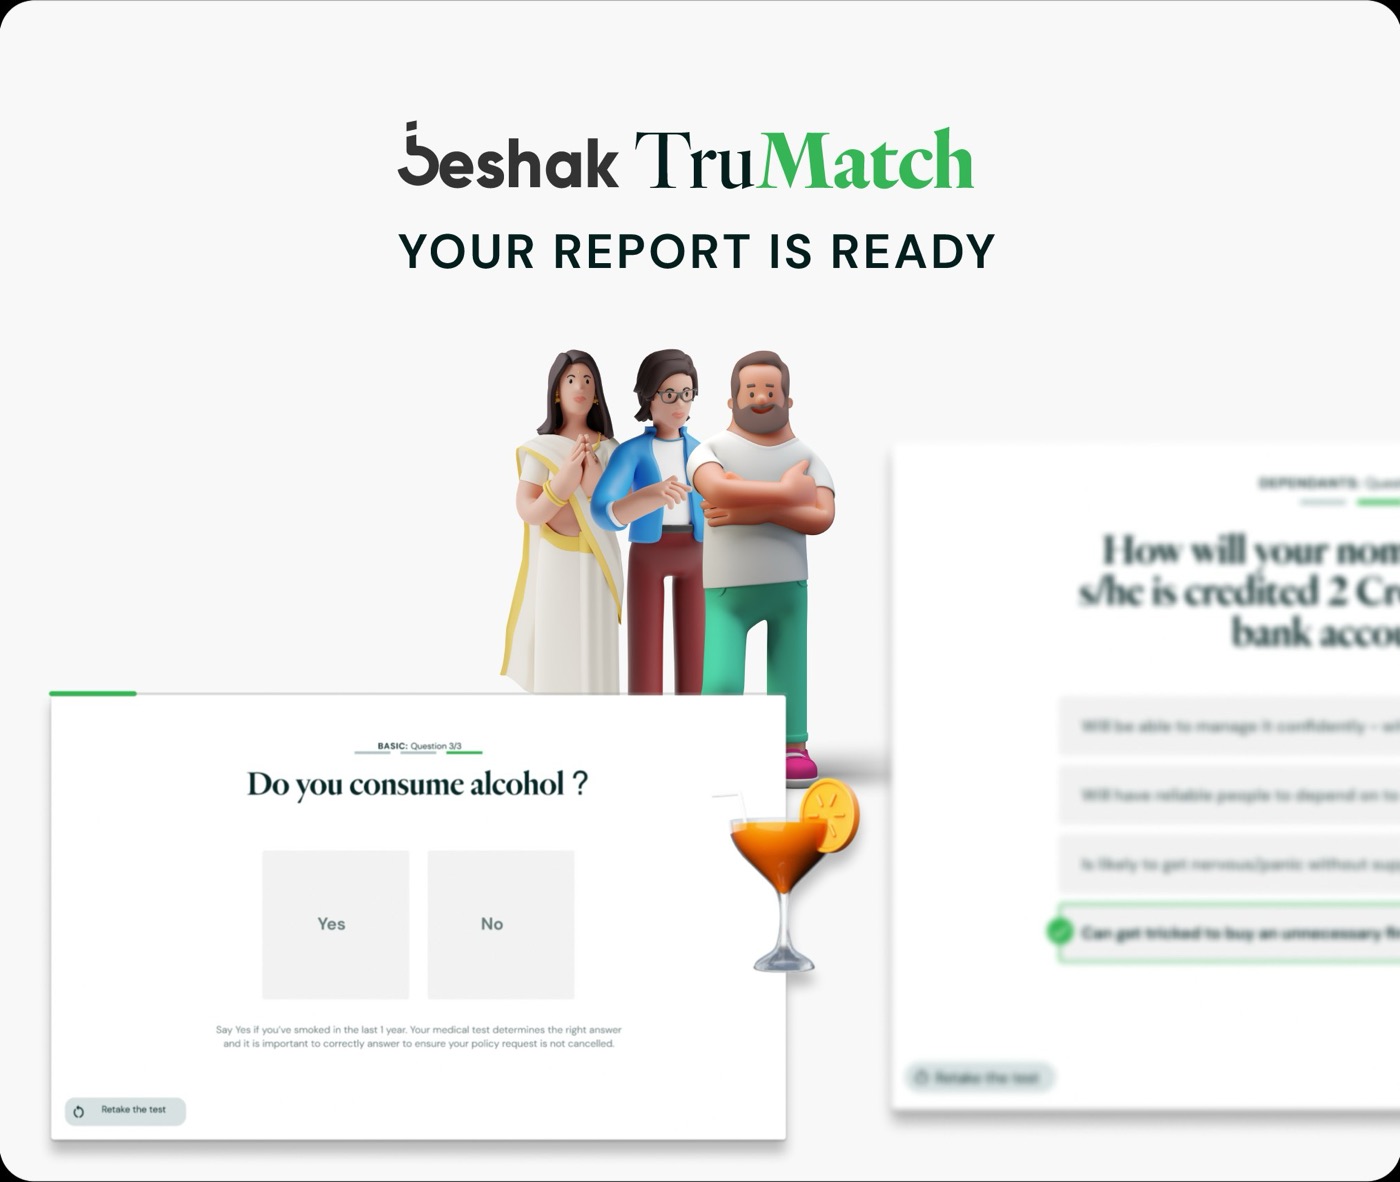
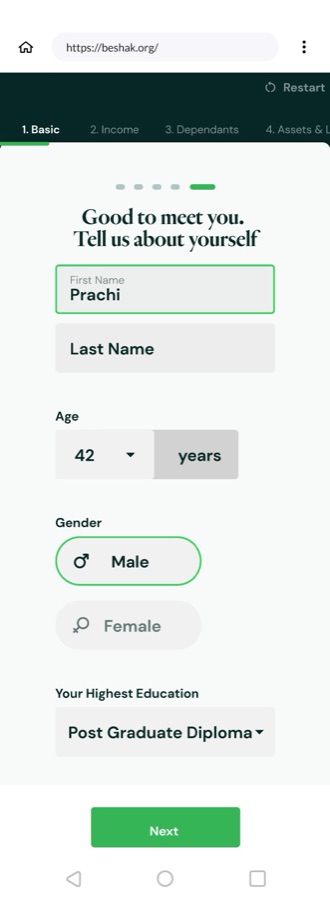
Beshak TruMatch
UI for an insurance recommendation flow: a guided questionnaire on web and mobile that ends in a personal report.
A design system for a company-wide React migration
Tokens, components, patterns and WCAG standards, documented in Figma and Storybook so squads ship consistent UI without waiting on design.
Adopted across 100% of product areasBeyond the brief
What I bring to a team besides the screens. Drag the row, or play with the first one.
Motion, felt not specced
Drag the ball and let go. stiffness 180 · damping 12
Illustrations
Spot illustrations and empty states, drawn for products and for fun.
Motion & interaction design
Springs, easing and micro-interactions, specced so engineers can build them.
Data viz
Interaction problems in dense revenue data, and what I'd try next.
Solutions consulting
Shaping fixes with enterprise clients, like 24 features in two months for a 5,000-listing portfolio.
User interviews
Talking to hosts and property managers before anything gets drawn.
Tickets
Specs with the edge cases written down, so engineering never waits on design.
RM AI agent
Hackathon: an AI revenue-manager agent, specced and prototyped in two days. Case study.
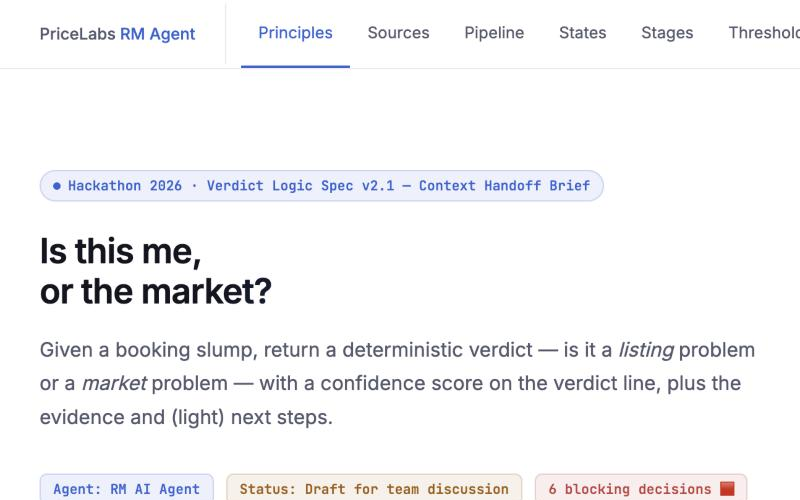
RM agent spec
Hackathon: the agent's spec as a live, clickable document.
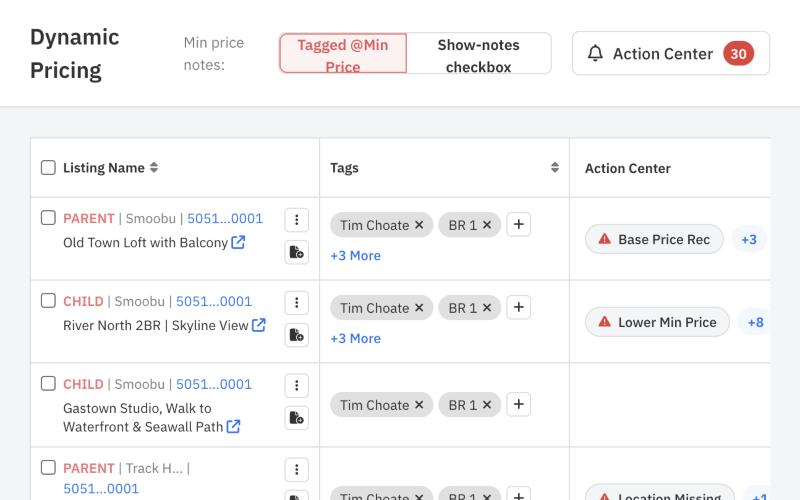
Action Center
Every listing problem with the one action that fixes it, on the web.
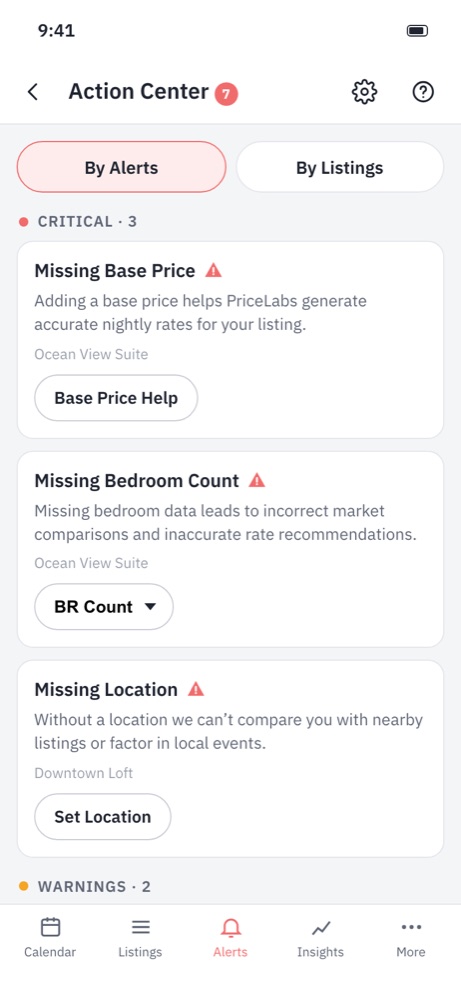
Action Center on mobile
The same fixes, thumb-first.
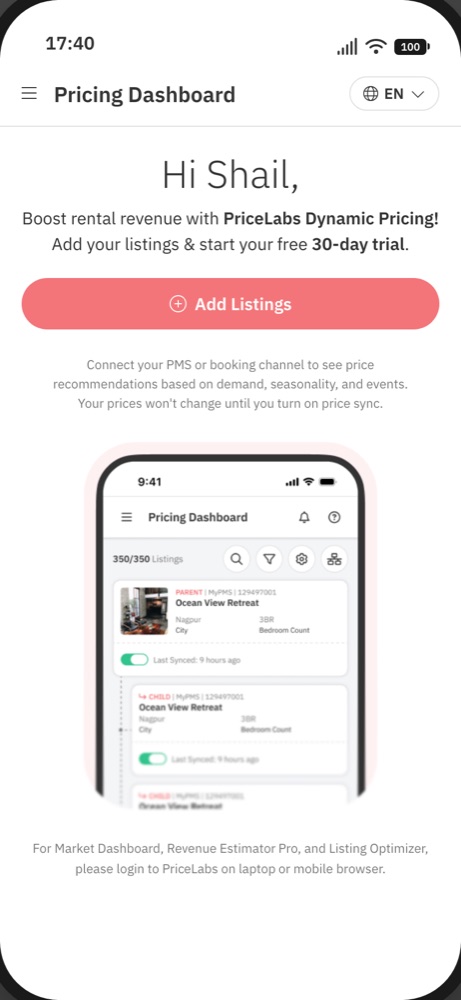
Mobile onboarding
Three-step setup for the PriceLabs app.
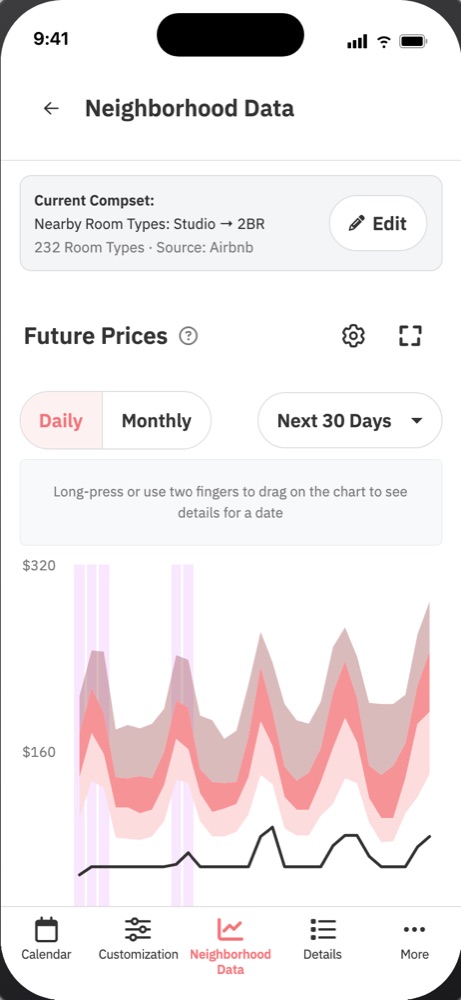
Neighbourhood data
Market data inside the pricing calendar.
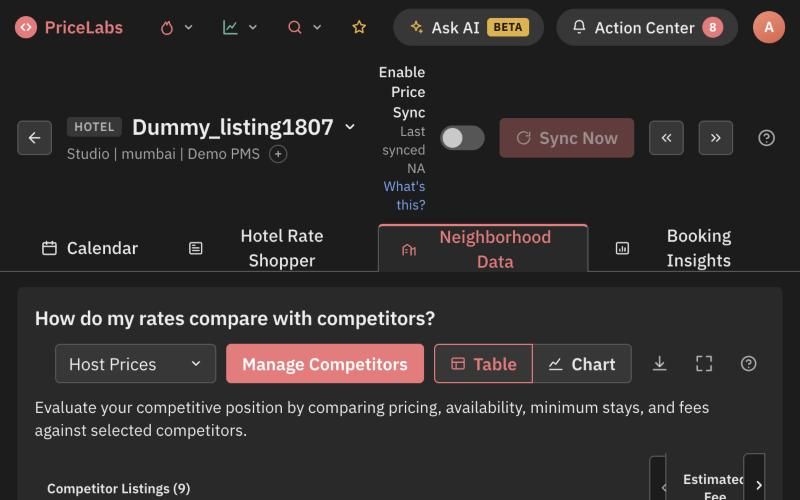
Competitor nicknames
Naming the listings you compete with, so comparisons read at a glance.
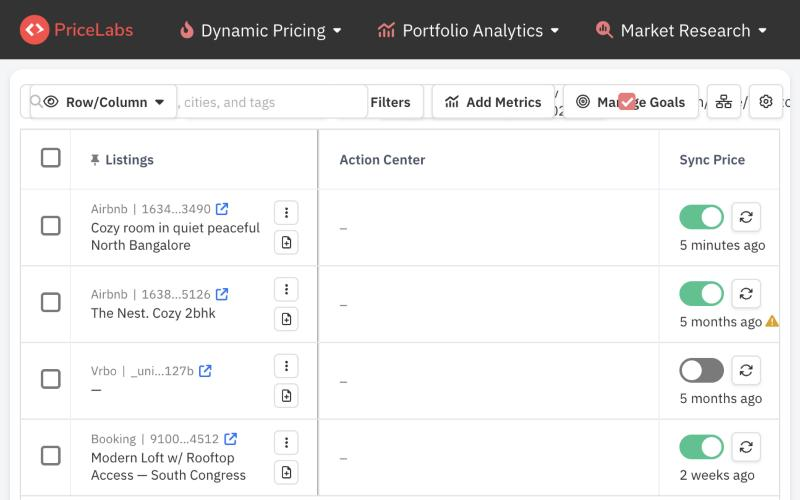
Multi-calendar columns
Hover details on a dense multi-listing calendar.
Block this date
Check-in and check-out restrictions, set in one sheet.
Oasis
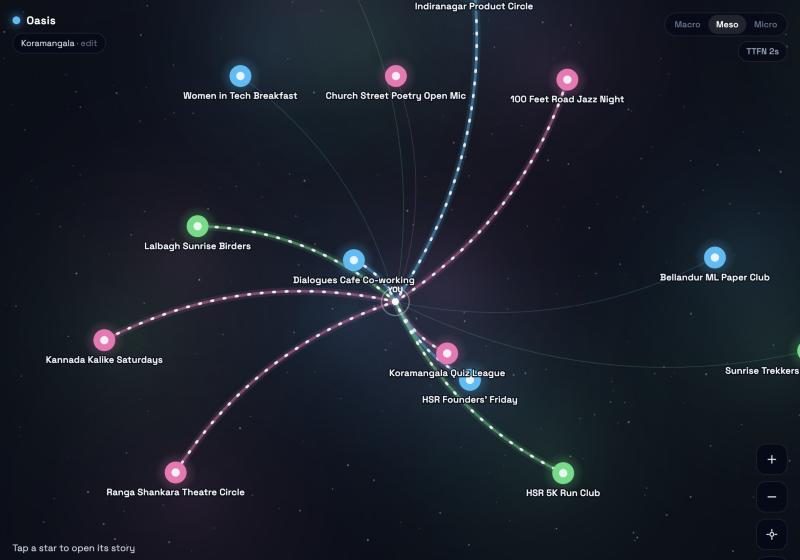
Bangalore redrawn by commute time.
PPump Health
Predicting pump failures two weeks out.
PPlant Energy
A plant’s energy data, turned into findings.

Tubes
A glowing-tube hero, rebuilt to learn it.
Engineering builds, interaction studies and data toys I make outside work. Get close to the black hole and it pulls you in, or take the stairs ↗

- Pump Health
Predicting pump failures two weeks out.
Chem engML - Plant Energy
A plant's energy data, turned into findings.
Chem engData - Oasis
Bangalore redrawn by commute time, as a constellation of people.
CanvasReact - Tubes
Rebuilding a glowing-tube hero to learn how it works.
WebGLStudy - The Poké Ball system
The motion system behind the Design Lab.
Motion3D - Time-Machine Portfolio
Forty-five years of SIPs and shocks.
FinanceData viz - Healthcare delivery
Redesigning how care gets delivered. In progress.
Service designLearning